The global ecommerce industry continues to grow, with global online retail sales projected to reach $7.95 trillion in 2027, while 80% of businesses are adopting AI strategies to reshape the shopping experience. At the same time, shifting consumer behavior and mobile adoption are redefining how businesses attract, convert, and retain customers.
Factors such as website speed, development quality, and user-friendliness are reflected in these trends, highlighting how ecommerce digital marketing services are becoming an important part of aligning performance with evolving user expectations and behaviors.
General Ecommerce Industry Overview
- The global ecommerce market will total $6.42 trillion in 2025, with ecommerce accounting for 20.5% of all global retail sales.
- There are nearly 28.25 million ecommerce sites on the web, accounting for approximately 2.52% of all websites globally.
- Approximately 2.77 billion people shop online as of 2025, representing roughly one-third of the global population.
- Amazon accounts for 40.9% of total US retail ecommerce sales, representing $540.29 billion in gross sales in 2025.
- By 2026, grocery is forecast to become the largest US ecommerce category, accounting for 19.0% of online sales.
- China, the US, and Western Europe account for 80.5% of global ecommerce revenue, generating more than $5.17 trillion combined in 2025.
- Ecommerce is expected to capture 41% of global retail sales by 2027, nearly double its 18% share in 2017.
- About 85.6% of consumers made an online purchase within the last month.
- 56.1% of internet users worldwide aged 16+ make an online purchase each week.
- Global social commerce sales will surpass $1.17 trillion in 2026, growing at a CAGR above 30%.

Global Ecommerce Market Size & Revenue Growth
- Global ecommerce sales grew 7.7% in 2024 and 6.8% in 2025, with growth forecast to rebound to 7.2% in 2026, reaching $6.88 trillion.
- By 2028, global ecommerce sales are projected to reach $7.89 trillion.
- Ecommerce’s share of total global retail sales will rise from 20.5% in 2025 to 22.5% by 2028.
- US retail ecommerce sales amounted to $1.19 trillion in 2024, up from $1.01 trillion in 2022.
- As of 2024, ecommerce represents a 16.13% share of all retail sales in the US.
- Global B2B ecommerce sales stand at over $32 trillion in 2026, dwarfing B2C.
- China remains the leading ecommerce market worldwide, generating the highest online sales at over $3 trillion, followed by the US and UK, each near $1 trillion.
- The global ecommerce fulfillment services market is worth $140.1 billion in 2025, growing at 13.2% year-over-year.
- Cross-border ecommerce accounts for approximately 18.8% of all global online sales, with 59% of global shoppers buying from retailers outside their home country.
- Online shopping will generate $10 trillion in annual revenue by 2033.
Ecommerce Conversion Rate Benchmarks
- In 2025, the average ecommerce conversion rate was 1.99%, down from 2.18% in 2024, based on IRP Commerce’s platform data.
- Toys, Games & Collectables had the highest conversion rate in 2025 at 3.21%, followed by Food & Drink at 2.24% and Fashion Clothing & Accessories at 2.15%.
- Only 2.86% of ecommerce website visits convert into a purchase on average.
- In 2025, mobile devices accounted for 71.4% of sales volume, desktop 27.3%, and tablet 1.3%, making mobile conversions more valuable than any other medium.
- In 2025, paid search represented 62.1% of sales by channel, making it the most effective conversion channel for businesses.
- Revenue per conversion rose to £1.97 in 2025, a 21.56% increase from £1.62 the year prior.
- Improving checkout design alone can increase conversion rate by 35.26% on large ecommerce sites.
- The average large ecommerce site has 39 potential areas for checkout improvement, even after running prior optimization projects.
- Every second a site loads faster increases conversion rates by 17%.
- Electrical & Commercial Equipment at 0.67% and Baby & Child at 0.52% are the lowest converting categories.
Cart Abandonment Statistics
- Global average cart abandonment rate is 77.15%, with APAC highest at 80.05%, EMEA at 79.21%, and the Americas at 73.4%.
- Mobile has the highest cart abandonment rate at 79.97% per Dynamic Yield, significantly above desktop at 67.56%.
- Ecommerce retailers lose approximately $18 billion annually due to abandoned carts.
- An estimated $260 billion in lost orders are recoverable in the US and EU annually through better checkout design.
- 48% of shoppers cite extra costs (shipping, taxes, and fees) that are too high as the #1 reason for cart abandonment.
- 43% of US online shoppers abandon a cart because they are ‘just browsing and not ready to buy’.
- 26% of shoppers abandon when required to create an account before purchasing.
- 18% of shoppers abandon due to a checkout process that is too long or complicated.
- 19% cite lack of trust with credit card information as a reason for abandonment.
- Travel & Hospitality has the highest industry abandonment rate at 87.1%. Fashion & Apparel is 84.6%, and Grocery & Essentials is the lowest at 50–62%.
Checkout Experience & Payment Behavior
- 5 in 10 consumers take into account the ease of checkout when deciding where to shop online.
- Free delivery (50.5%), coupons and discounts (39.1%), and customer reviews (32.1%) are the top three online purchase drivers worldwide.
- 13% of customers will abandon a checkout if their preferred payment method is not available.
- 10% of shoppers abandon carts when there are not enough payment methods available.
- Digital wallets paid for 53% of global online purchases in 2024; this is projected to increase to 65% by 2030.
- There are an estimated 161.6 million mobile wallet users in the US, accounting for 64.9% of US smartphone users.
- Buy Now Pay Later (BNPL) transactions in the US were estimated at $133 billion in 2024, up 14% year-over-year.
- Fast and reliable shipping is the most important purchase factor for 58% of online shoppers, followed by secure payment methods (48%) and competitive pricing (46.8%).
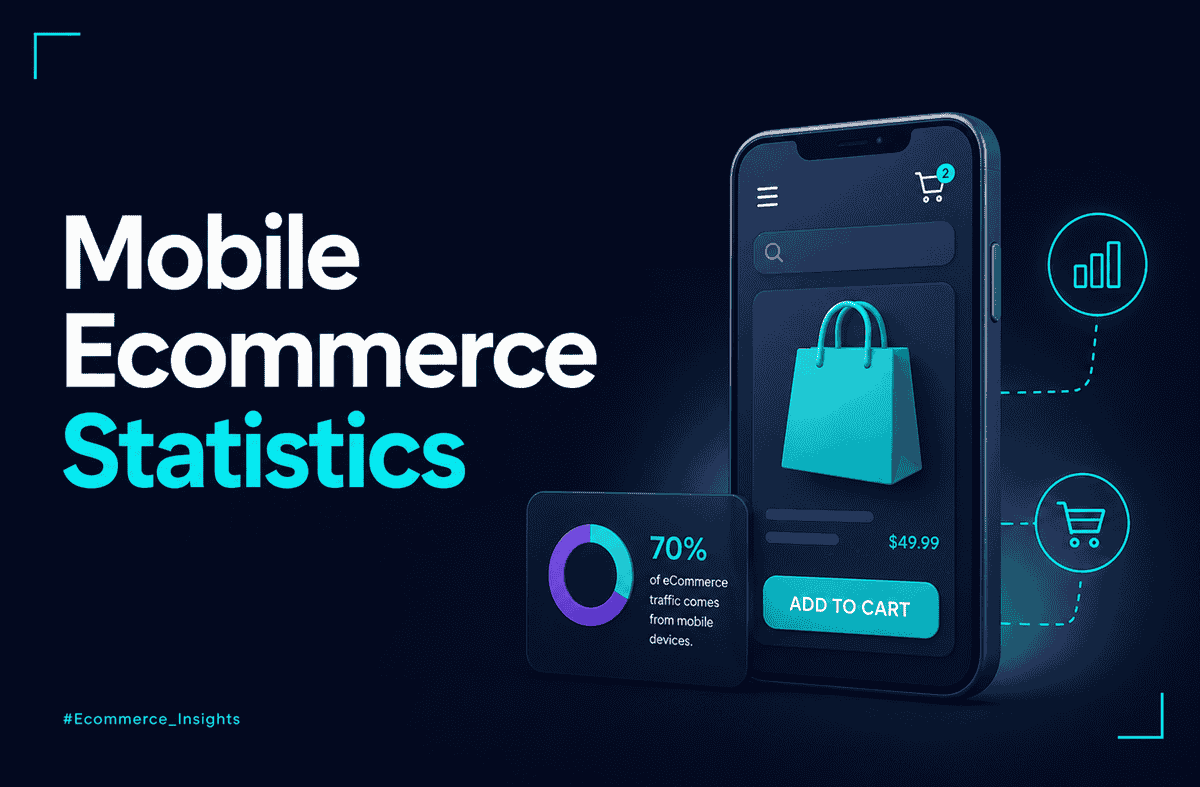
Mobile Ecommerce Statistics
- Revenue from mobile ecommerce sales worldwide reached $2.51 trillion in 2025, accounting for 59% of total ecommerce sales.
- Smartphones generate nearly 78% of retail site traffic and 68% of online shopping orders globally.
- Mobile commerce is expected to account for nearly 60% of total online retail sales, equivalent to $4.01 trillion, in 2026.
- Mobile ecommerce accounts for 44.1% of US online sales in 2024, representing $564.1 billion in order value.
- By 2027, mobile commerce is forecast to reach $856.4 billion in US sales, accounting for 49.79% of all US online sales.
- 1.65 billion people are expected to shop via smartphone in 2026, one-third of the global digital population.
- Mobile shopping carts have an abandonment rate of 85.65%, significantly higher than desktop.
- Despite mobile generating the majority of traffic, mobile conversion rates average just 2.1% compared to desktop’s 3.5%.
- The average order value on desktop is $155, compared to just $112 on mobile, a gap driven by poor mobile checkout experiences.
- 70% of US mobile shoppers prefer to make purchases through dedicated ecommerce apps rather than mobile websites.
Customer Acquisition & Marketing Cost Statistics
- Acquiring a new customer is 5 times more expensive than retaining an existing one.
- The probability of selling to a new customer is just 5-20%, compared to 60-70% for existing customers.
- The average online retailer has a repeat customer rate of 28.2%.
- The Higher Education industry has the highest average CAC ($1,143), followed by Real Estate ($791), and Financial Services ($784).
- B2B SaaS has the lowest average CAC ($239), followed by Entertainment ($260), and construction ($281)
- Customer acquisition costs have risen by 222% over the last 8 years.
- Companies that use AI in their marketing strategy have seen up to 50% reductions in their acquisition costs.
- Websites are the most popular customer acquisition channel, with 89% usage.
Email Marketing & Customer Retention Statistics
- The probability of an ecommerce brand selling to an existing customer is 60–70%, compared to 5–20% for a new customer.
- Loyal online customers are worth 22 times more to a business than new or fair-weather customers.
- 40% of shoppers will pay more for products from a trusted brand they are loyal to.
- 45% of all cart abandonment emails are opened, 21% are clicked, and 50% of those clicks lead to a recovered purchase.
- 55% of email marketers plan to focus on personalization for higher engagement rates.
- Almost 50% of email marketers want to automate more parts of their email marketing workflows.
- Loyalty programs are effective for boosting conversions, with an annual revenue growth of 12–18%.
- 80% of loyalty program owners plan to increase their investment.
- 67% of clicks on cart abandonment emails sent post-abandonment lead to a recovered purchase.
Product Pages, Reviews & Trust Signals
- 99% of shoppers read product reviews before making a major purchase.
- Nine out of ten consumers rely on online reviews for buying decisions, while around 54.7% read at least four reviews before purchasing.
- 59% of online shoppers use Google to find reviews, and 57% use Amazon.
- 92% of consumers are hesitant to consider a product without online reviews.
- Conversion rates increase 270% when online retailers display five or more product reviews.
- 87% of consumers believe product description is the most important factor when deciding to purchase online, as they cannot physically see or feel the item.
- 67% of buyers say high-definition images are more convincing than plain product descriptions.
- 76% of consumers are more likely to trust reviews when they include a mix of ratings rather than only 5-star reviews.
- 62% of consumers avoid brands that censor online reviews.
- 93% of US consumers say reviews influence their purchasing decisions, making review collection a core post-purchase strategy.
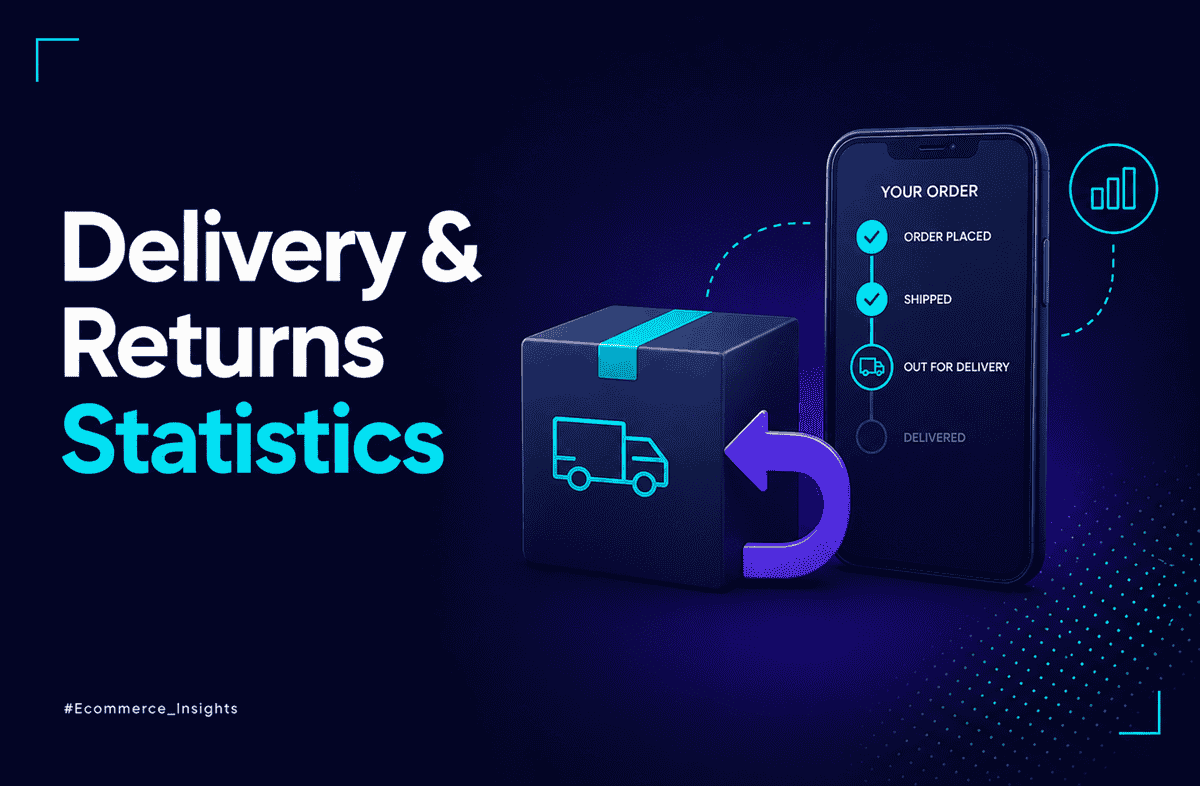
Shipping, Delivery & Returns Statistics
- 79% of consumers are more likely to shop online when free shipping is offered, while 80% are willing to meet a minimum purchase threshold to qualify.
- 55% of shoppers abandon carts due to unexpected fees, including shipping costs.
- 21% of shoppers abandon carts because delivery was too slow, and 15% cite an unsatisfactory returns policy.
- The average ecommerce return rate was approximately 16.9% in 2024.
- Returned products cost US retailers $890 billion in 2024.
- Clothing has the highest return rate of any category at 25%; it is the top returned product category in ecommerce.
- 85% of US BOPIS shoppers have made an additional unplanned purchase when going to collect their order in-store.
- 76% of first-time customers are likely to shop again with a retailer that provides a smooth, hassle-free returns experience.
- 61% of shoppers expect their packages to arrive within 1–3 hours, reflecting extreme delivery speed expectations set by quick-commerce platforms.
- 82% of shoppers in 2025 cite free returns as an important consideration when making a purchase online, up from 72% in 2024.
SEO & Organic Traffic for Ecommerce
- 23.6% of all ecommerce orders come directly from organic search traffic.
- 43% of all ecommerce website traffic comes from Google’s organic search results.
- 59% of potential customers use Google to find information about products they intend to purchase.
- Slow-loading websites cost their owners over $2 billion in lost sales each year.
- Long-tail keywords (queries of three or more words) account for 56% of customer search queries in ecommerce.
- 19% of marketing specialists plan to develop an SEO strategy specifically for generative AI search in 2025.
- 83% of online buyers use Google Search to check product reviews before purchasing.
- The search volume for gift-related search queries increases from 15% to 45% during the holiday month.
AI in Ecommerce Statistics
- 80% of retail executives expected their companies to adopt AI-powered automation by the end of 2025.
- AI in the ecommerce market is projected to reach $8.65 billion by 2026.
- 91% of consumers are more likely to shop with brands that provide personalized AI-driven offers and recommendations.
- 71% of consumers feel frustrated when their shopping experience is impersonal.
- Companies that master AI personalization generate 40% more revenue on average than their peers; product recommendations alone can increase revenue by up to 300%.
- Amazon attributes 35% of its revenue to AI-powered product recommendations.
- 61% of consumers have used GenAI tools like ChatGPT for online shopping; 53% use or plan to use AI for online shopping.
- On Prime Day 2025, Amazon’s traffic from AI shopping assistants increased 3,300% year-over-year.
- 82% of consumers would rather deal with a chatbot than wait 15 minutes to speak to a real person.
- 39% of US consumers state they have already used generative AI while shopping online, primarily for product research (55%) and recommendations (47%).
Consumer Behavior & Online Shopping Trends
- For 43% of US Gen Z consumers, marketplaces were the starting point of their online shopping journeys in 2024, while another 24% used search engines.
- 50% of consumers start their online product searches at Amazon.
- More than 7 in 10 US adults believe home delivery, free shipping, and in-stock products are necessary online shopping attributes.
- 48.8% of customers started shopping on general retailer websites or apps in 2024, while 86% make their online purchases most frequently through these platforms.
- 73% of retail shoppers engage across multiple channels during their buying journey, making an omnichannel presence essential.
- Companies with strong omnichannel engagement strategies see 179% faster revenue growth than those without.
- US click-and-collect sales totalled $154.3 billion in 2025.
- 52% of global online shoppers report buying from retailers in other countries.
- 49% of shoppers make unplanned purchases due to receiving personalized product recommendations.
- The holiday season drives 24% of online shopping activity; Black Friday and Cyber Monday drive another 20.4%.
Ecommerce Business Challenges & Failure Statistics
- Ecommerce companies are estimated to lose $48 billion to fraud each year; every $100 in fraudulent orders results in $207 in total losses.
- The cumulative merchant loss to online payment fraud will exceed $362 billion between 2023 and 2028.
- 14% of small ecommerce businesses report low website traffic as a primary challenge, while 11% struggle with website building and maintenance costs.
- Around 29% of small businesses faced challenges utilizing technology, including ecommerce, cybersecurity, or social media.
- 88% of users are less likely to return to a website after a bad experience, directly impacting repeat purchase rates and lifetime value.
- A 1-second delay in mobile load time can impact conversion rates by up to 20%; 53% of mobile users abandon sites that take over 3 seconds to load.
- Ecommerce bounce rate increased from 39.81% in 2024 to 42.16% in 2025, and cost-per-acquisition as a percentage of revenue rose from 7.46% to 8.15%.
Ecommerce by Industry
- Fashion is the top product category by online sales revenue globally, with the fashion ecommerce segment forecast to exceed $920 billion in 2025.
- Clothing (67.1%), shoes (44%), and beauty products (43.1%) are the top three most purchased categories by US digital buyers.
- Personal care items lead the list of top online purchases, with 65.6% of online customer purchases in the last six months, followed by groceries at 65.2% and apparel at 63.6%.
- In December 2025, Food & Drink achieved the highest conversion rate at 2.24% among major IRP-tracked categories.
- Beauty & Personal Care had the lowest checkout rate of any ecommerce industry over the past twelve months at 18%, while Pet Care & Vet Services had the highest at 48%.
- Food & Beverage and Automotive products have the fastest year-over-year online sales growth among all categories in 2024, up 17.2% and 21.4%, respectively.
- Online grocery sales in the US totaled $219.3 billion in 2024, accounting for 13.7% of all grocery purchases.
- Global online grocery sales are expected to total up to $939 billion in 2025.
Future Ecommerce Trends & Projections
- By 2027, online sales are expected to account for 22.6% of total global retail sales.
- By 2030, ecommerce is projected to make up 23.9% of global retail sales.
- Social commerce is projected to reach $2.9 trillion by 2026, driven by TikTok Shop, Instagram Stores, and live selling formats.
- TikTok Shop sales grew 150% year-over-year globally; TikTok Shop is forecast to surpass major retailers in ecommerce sales by 2026.
- The global BNPL market is projected to grow from $28.44 billion to $83.36 billion by 2034.
- AI in the ecommerce market is set to more than double by 2032, with the global retail AI market valued at $41.08 billion in 2025.
- Between 2025 and 2030, the US retail AI market will have a CAGR of 32.5%; the global retail AI market will have a CAGR of 32.0%.
- Cross-border ecommerce is projected to increase by 107% by 2028 from a $1.9 trillion base in 2024.
- Mobile commerce will account for 62% of all ecommerce transactions by 2027.
- U.S. click-and-collect retail sales will total an estimated $177.9 billion in 2026, up 15.3% year-over-year.
Final Thoughts
These ecommerce statistics highlight measurable trends across market growth, consumer behavior, and digital performance. From conversion rates to mobile adoption and AI-driven personalization, the data reflects how the industry continues to evolve.
Businesses can use these benchmarks to assess performance, identify gaps, and align strategies with current market conditions and emerging patterns. At the same time, investing in strong ecommerce web design and development services plays a critical role in translating these insights into real performance
References
- Backlinko. (2025). Ecommerce Statistics. Retrieved from https://backlinko.com/ecommerce-stats
- Baymard Institute. (2025). Cart Abandonment Rate Statistics. Retrieved from https://baymard.com/lists/cart-abandonment-rate
- Capital One Shopping. (2025). Online Shopping Statistics. Retrieved from https://capitaloneshopping.com/research/online-shopping-statistics/
- Charle Agency. (2025). Ecommerce Statistics. Retrieved from https://www.charleagency.com/articles/ecommerce-statistics/
- Dynamic Yield. (2025). Cart Abandonment Rate Benchmarks. Retrieved from https://marketing.dynamicyield.com/benchmarks/cart-abandonment-rate/
- Elementor. (2026). Ecommerce Statistics. Retrieved from https://elementor.com/blog/ecommerce-statistics/
- Flowlu. (2025). Ecommerce Statistics. Retrieved from https://www.flowlu.com/blog/productivity/ecommerce-statistics/
- GTM 80/20. (2026). 38 Customer Acquisition Cost Statistics for B2B SaaS in 2026. Retrieved from https://www.gtm8020.com/blog/customer-acquisition-cost-statistics
- Hostinger. (2025). Ecommerce Statistics. Retrieved from https://www.hostinger.com/tutorials/ecommerce-statistics
- SellersCommerce. (2025). Shopping Cart Abandonment Statistics. Retrieved from https://www.sellerscommerce.com/blog/shopping-cart-abandonment-statistics/
- SEOProfy. (2025). Ecommerce Marketing Statistics. Retrieved from https://seoprofy.com/blog/ecommerce-marketing-statistics/
- Shopify. (2025). Global Ecommerce Sales Statistics. Retrieved from https://www.shopify.com/blog/global-ecommerce-sales
- SpeedCommerce. (2025). Ecommerce Benchmarks Conversion Rates By Industry Over Time. Retrieved from https://www.speedcommerce.com/insights/ecommerce-benchmarks-conversion-rates-by-industry-over-by-year/
- Upsella. (2026). Cart Abandonment Statistics 2026. Retrieved from https://upsella.com/blog/statistics/cart-abandonment-statistics-2026
- Vena Solutions. (2024). Average Customer Acquisition Cost by Industry. Retrieved from https://www.venasolutions.com/blog/average-cac-by-industry